Understanding MAP (Measures of Progress Testing) Results
Video Resources, Parent Guides, and FAQs
MAP is a tool used by Snyder ISD and districts nationwide at the beginning, middle, and end of the school year. Unlike the STAAR test, MAP tests measure progress instead of mastery.
The test adapts to each child based on how they answer test questions. The goal of the test is not to score 100% of the questions correctly; instead, each child's test becomes a unique experience for them, identifying strengths, areas needing improvement, and ideas for enrichment.
The MAP results are useful to teachers as well, allowing them to see where students may have missed important concepts and where they are successful, and make changes to meet their needs. Please reach out to your child's teacher or principal with any questions, we are here to help!
Video Resources
Understanding MAP Growth
MAP Growth - Lyla's Story
MAP Growth - Michael's Story
MAP Growth Kit de Herramientas para Padres
Frequently Asked Questions
1. What is MAP Growth and what does it measure?
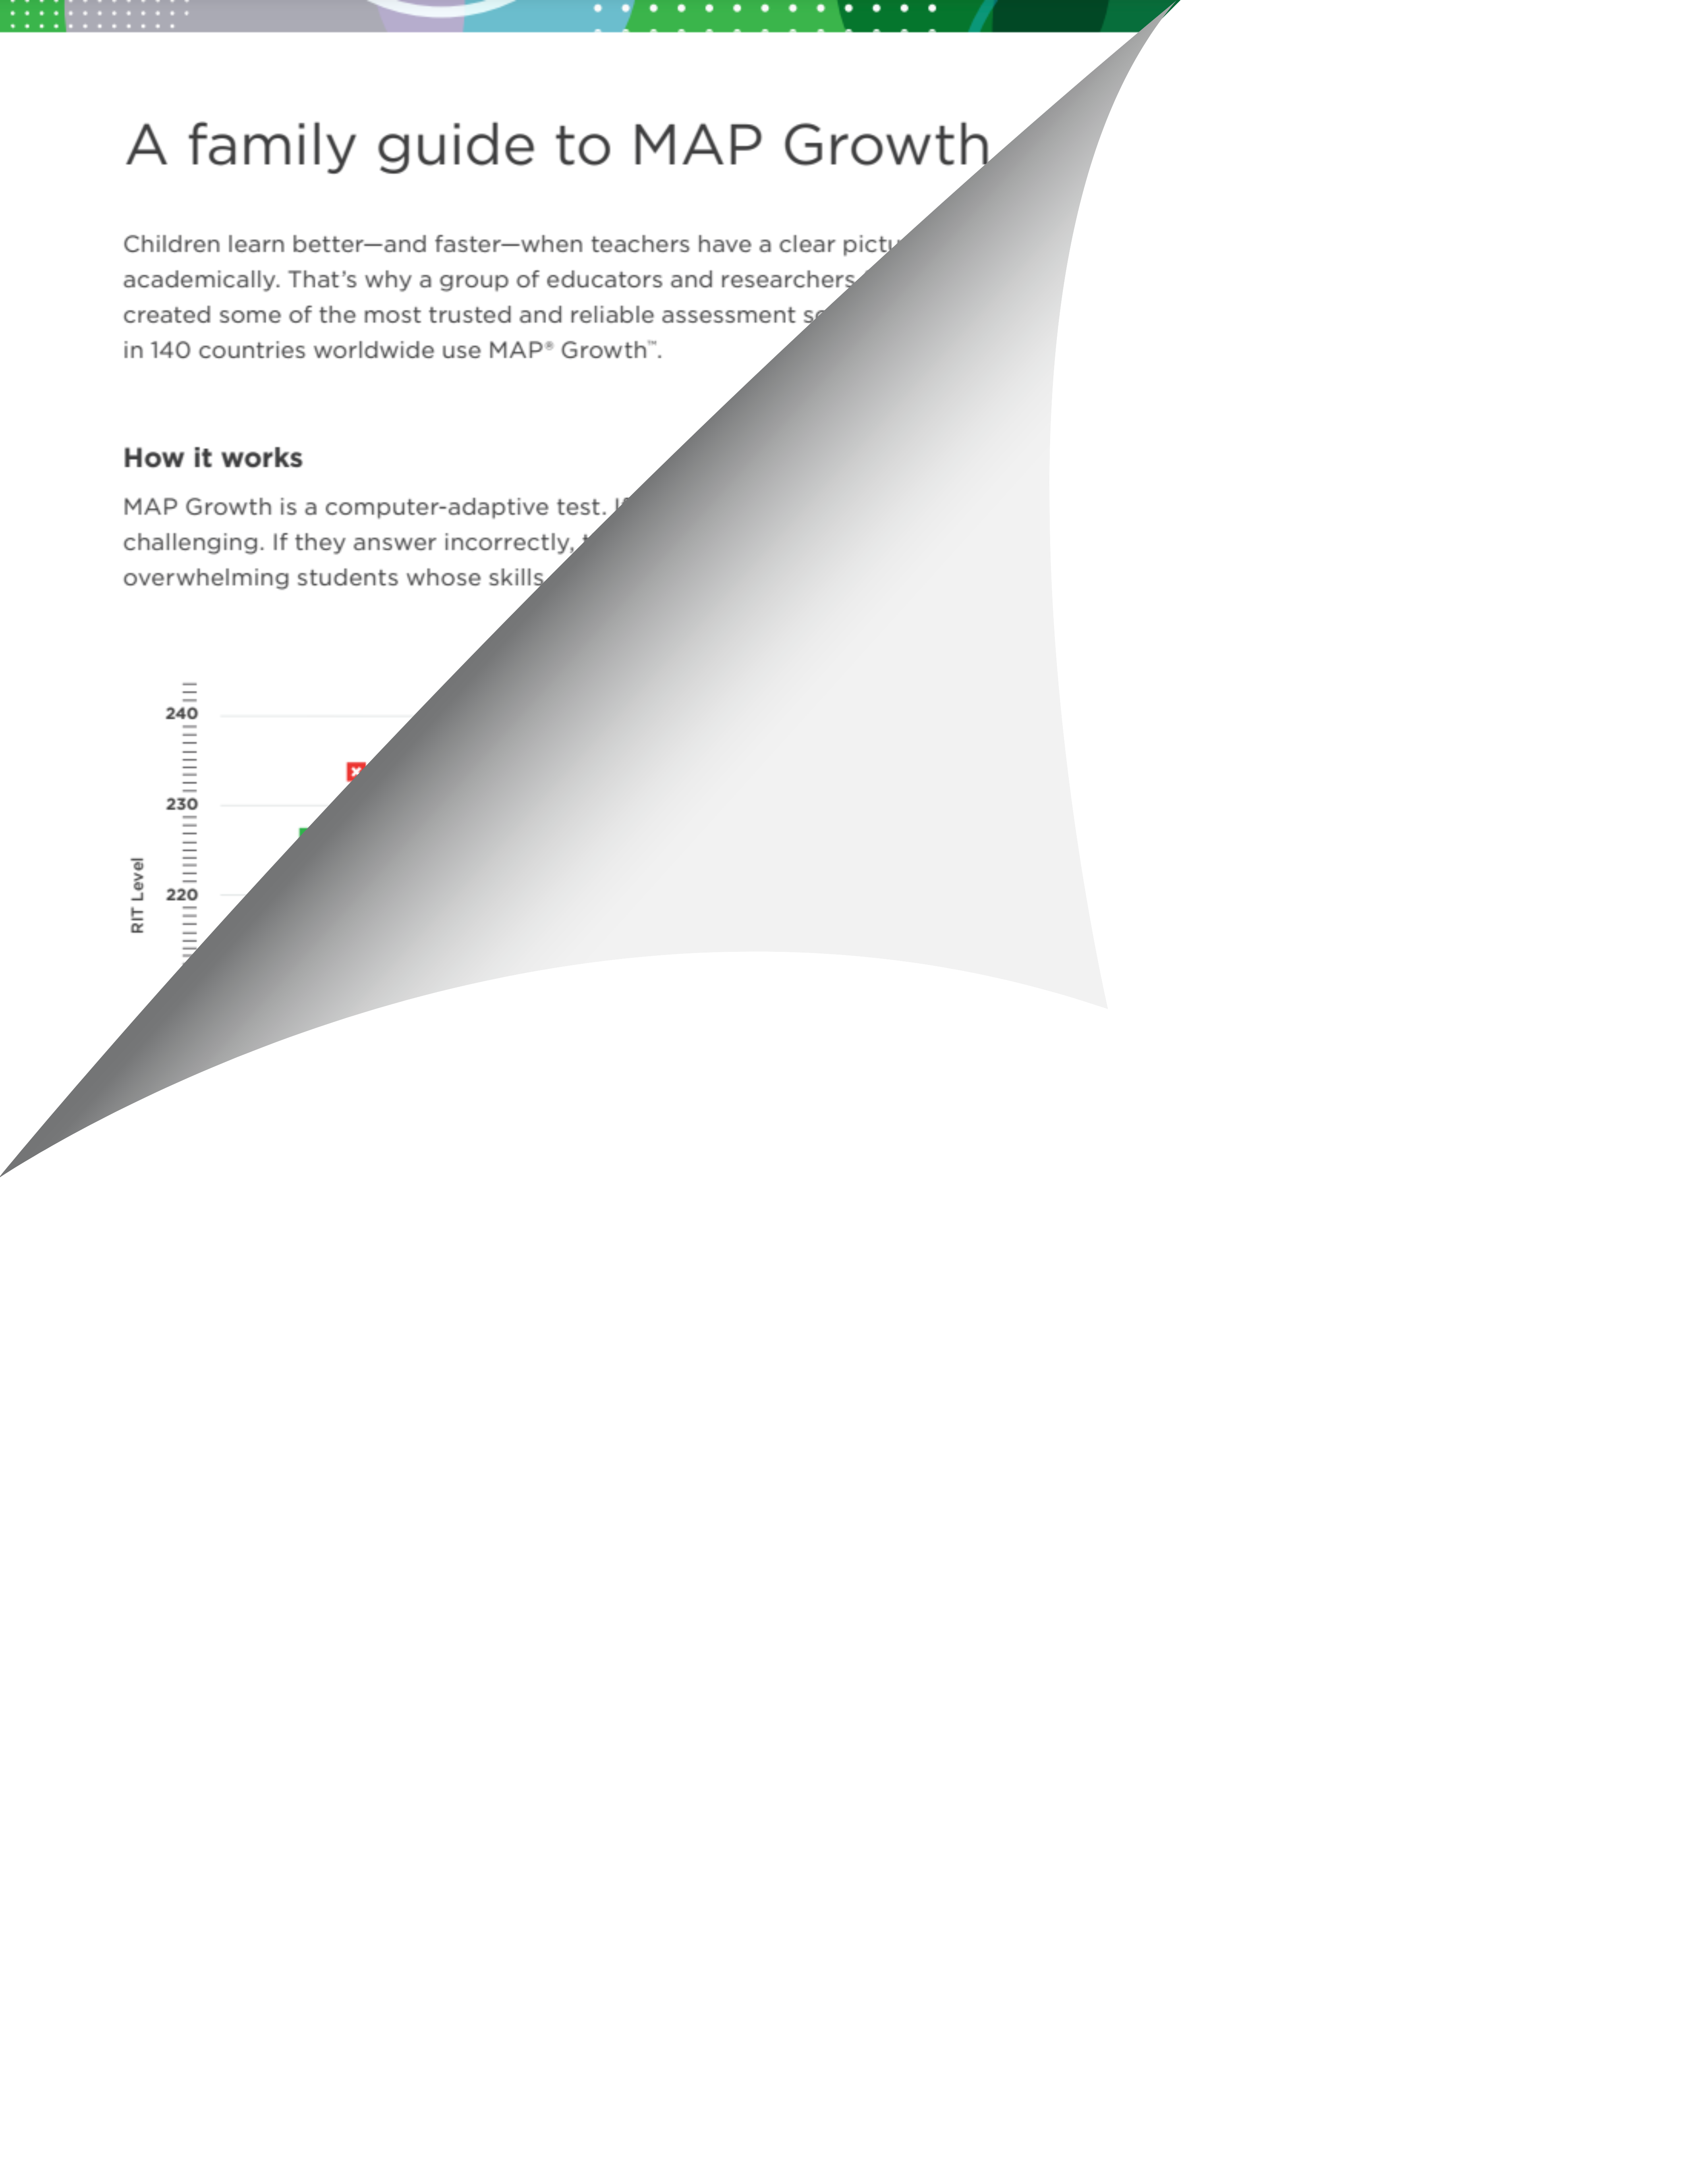
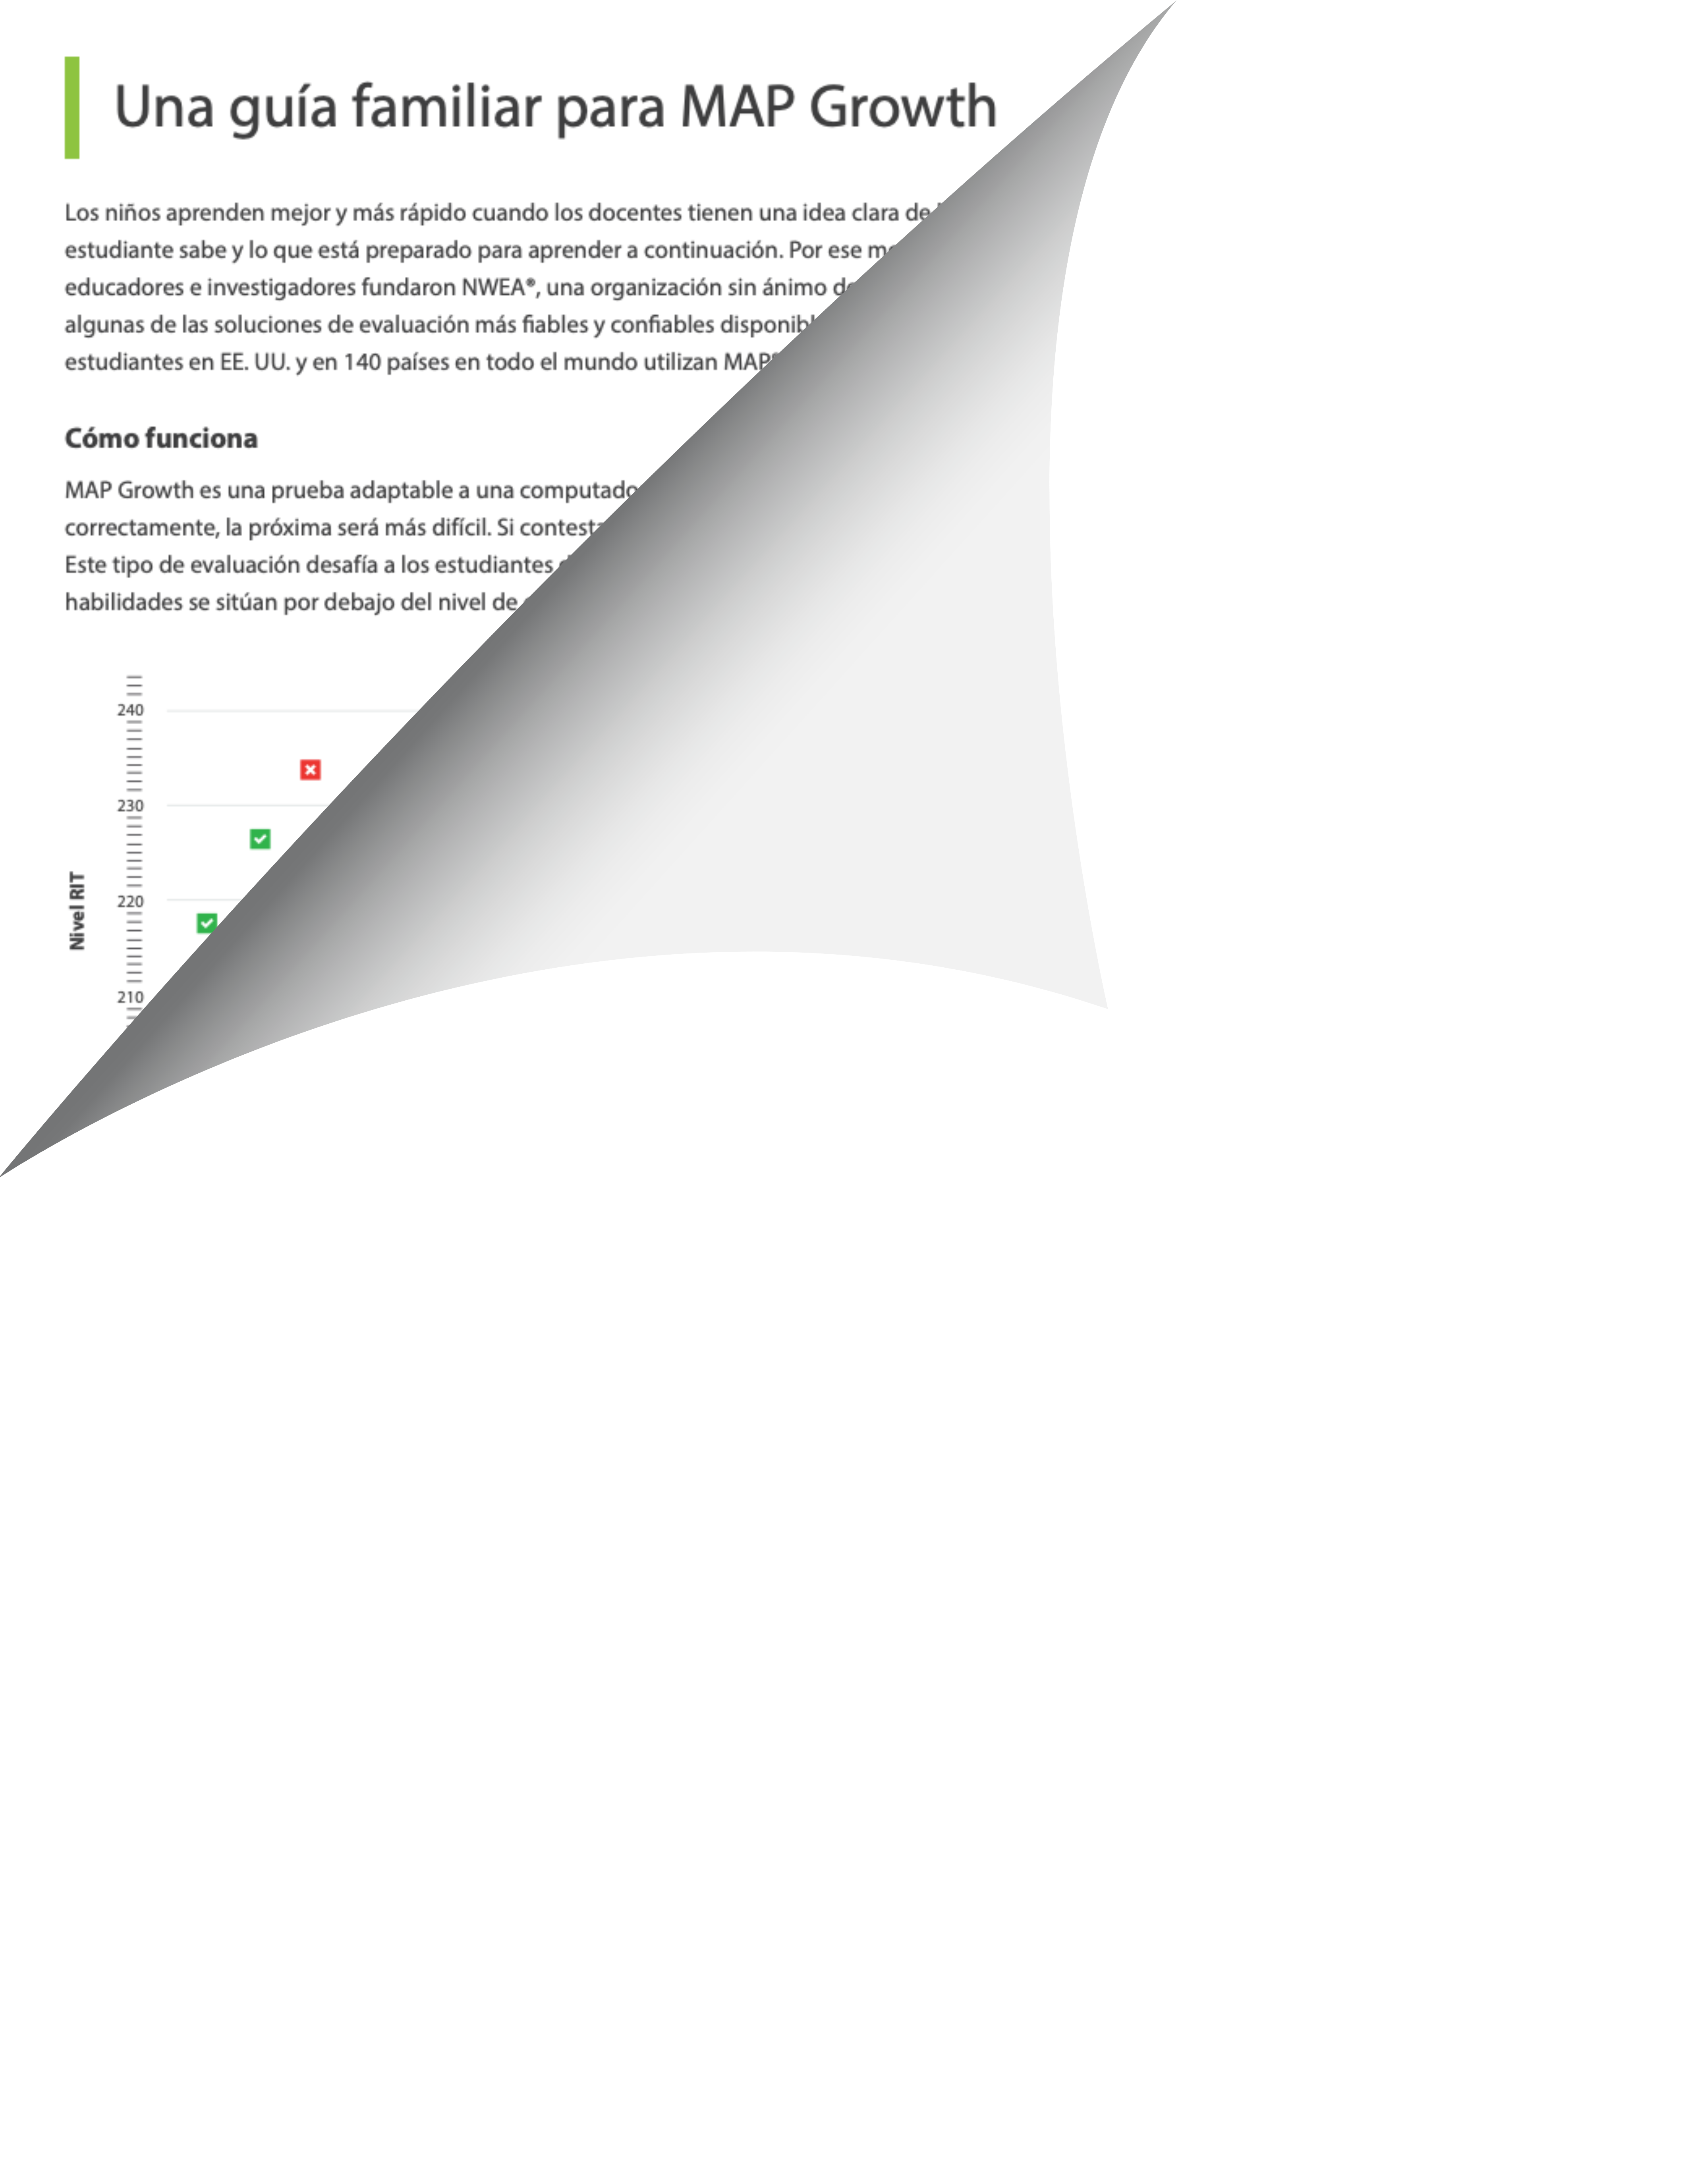
Unlike paper-and-pencil tests, where all students are asked the same questions and spend a fixed amount of time taking the test, MAP Growth is a computer-adaptive test. That means every student gets a unique set of test questions based on responses to previous questions. As the student answers correctly, questions get harder. If the student answers incorrectly, the questions get easier. By the end of the test, most students will have answered about half the questions correctly, as is common on adaptive tests. The purpose of MAP Growth is to determine what the student knows and how they are growing academically.
MAP Growth is designed to measure student achievement in the moment and growth over time.
MAP Growth tracks students’ individual growth over time, wherever they are starting from and regardless of the grade they are in. For instance, if a third-grader is actually reading like a fifth-grader, MAP Growth will be able to identify that. Or, if a fifth-grader is doing math like a third-grader, MAP Growth will identify that, too. Both things are incredibly important for a teacher to know so that they can plan instruction efficiently.
2. What is a RIT score?
When students finish their MAP Growth test, they receive a number called a RIT score for each subject they are tested in: reading, language usage, math, or science. This score represents a student’s achievement level at any given moment and helps measure their academic growth over time. The RIT scale is a stable scale, like feet and inches, that accurately measures student performance, regardless of age, grades, or grade level. Like marking height on a growth chart and being able to see how tall a child is at various points in time, you can also see how much they have grown between tests.
3. How often will my child take MAP Growth?
Most schools give MAP Growth tests to students at the beginning, middle, and end of the school year. Some schools may include a summer testing session as well.
4. How long is MAP Growth?
Most students take around 45 to 55 minutes to complete a MAP Growth test. However, MAP Growth is not timed, and students may take as much time as they need to complete it.
5. Is MAP Growth a standardized test? How is it different from “high-stakes” tests?
Unlike standardized tests, MAP Growth is administered periodically during the school year, and it adjusts to each student’s performance, rather than asking all students the same questions. When we talk about high-stakes tests, we are usually talking about a test designed to measure what students already know, based on what is expected at their grade level. High-stakes tests are also often used as a way to measure grade-level proficiency. MAP Growth is designed to measure student achievement in the moment and growth over time, regardless of grade level, so it is quite different.
By the end of the test, most students will have answered about half the questions correctly, as is common on adaptive tests. The purpose of MAP Growth is to determine what the student knows and is ready to learn next.
Another difference is the timeliness of the results. While states often return information in the fall after the test is taken, MAP Growth gives quick feedback to teachers, administrators, students, and families. Teachers receive immediate results with MAP Growth that show what students know and where there might be common learning opportunities in the class. One similarity is that MAP Growth aligns to the same standards in a given state as the state test, so both measure similar content.
6. What information will I receive from my child’s school?
Most schools will provide you with the MAP Growth Family Report. This report contains information and scores from a student’s most recent MAP Growth assessments. It’s a good idea to discuss results with teachers for a full understanding of what the information means and how they can use their child’s reading and math scores to identify resources that can support home learning.
7. How do schools and teachers use MAP Growth scores?
NWEA provides many different reports to help schools and teachers use MAP Growth information. Teachers can see the progress of individual students and of their classes as a whole. Teachers use RIT scores combined with formative assessment to develop classroom-level strategies for equitable instruction that help maximize every student’s learning potential. MAP Growth also provides data around the typical growth for students who are in the same grade, are testing in the same subject, and have the same starting achievement level. This data is often used to help students set goals and understand how much they need to learn to achieve their goals. Principals and administrators can use the scores to see the performance and progress of a grade level, school, or entire district.
8. Can MAP Growth tell me if my child is working at grade level?
Just as a doctor has a chart indicating the most common heights and weights of people at certain ages, NWEA has put together charts showing the mean RIT scores for students at various grade levels. NWEA researchers examined the scores of millions of students to find the average scores for students in various grades.
9. What subjects are available with MAP Growth?
MAP Growth in English covers the following:
Reading: Grades K–12
Language Usage: Grades 2–12
Math: Grades K–12
Science: Grades 2–12
MAP Growth in Spanish covers:
Math: Grades K–12
Reading: Grades K–8
Note that the reading and math tests for grades K–2 are referred to as MAP Growth K–2. These child-friendly tests for young learners offer students the ability to wear headphones, since many questions include audio to assist students still learning to read.
10. What types of questions are on the MAP Growth tests? Are there sample tests?
The MAP Growth tests include multiple choice, drag and drop, and other types of questions. You can access some short sample tests to get an idea of what MAP Growth questions look like.
11. How can I help my child prepare for MAP Growth?
Your child’s teacher will help with any pre-test instructions to explain the test to the students. Just like on any school day, make sure your child is well-rested and fed. Encourage them to do their best.
Family Guide
Learn how MAP works, how it is measured, and how it is scored.


